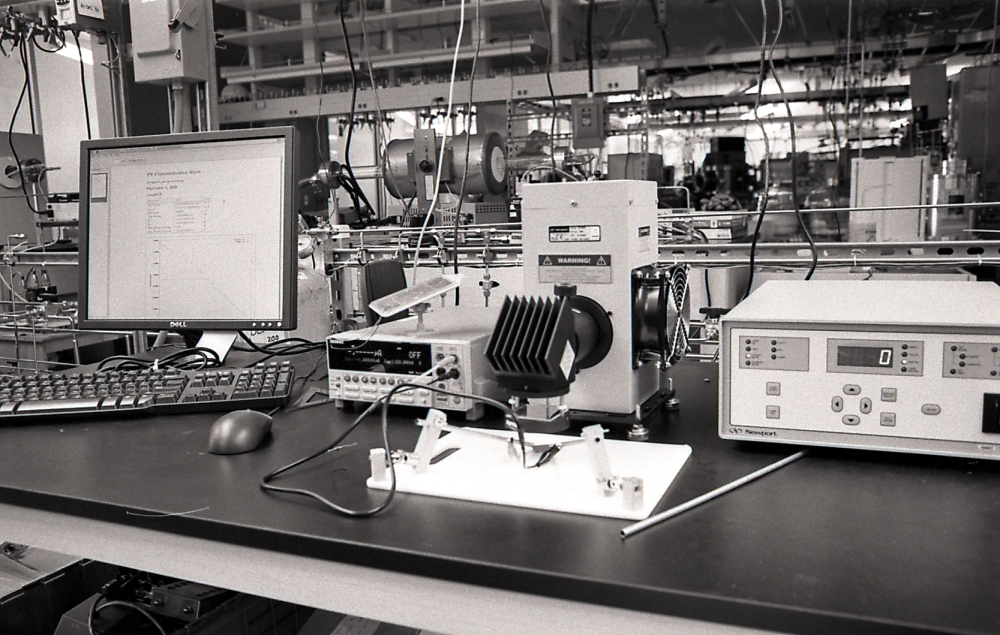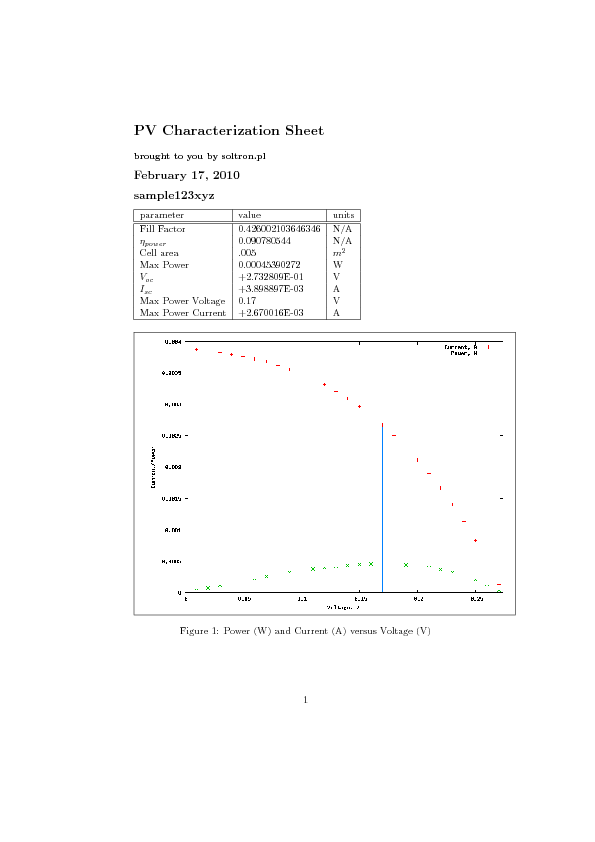
As part of my graduate research in photovoltaic materials, I needed the ability to run current/voltage tests on solar cells. By running a I-V sweep on a solar cell and charting the data, a great deal of information about the cell's performance can be extracted. Parameters such as the open circuit voltage, the closed-circuit maximum current, the "fill factor", and so on can be measured with one I-V sweep.
To satisfactorily test the cell, the data must be gathered while the cell is illuminated with a standard amount and character of light. For this purpose I purchased a solar simulator, which uses an arc lamp to create a standardized AM 1.5 spectral output. This provided the light, but now I needed the electrical equipment to run the tests.
One option would be to purchase a National Instruments DAQ card for a desktop PC, and run the freely-available LabView programs for testing solar cells. However, we did not have the budget for a DAQ card. Instead, I used a Keithley SourceMeter benchtop source-measure unit to do the current and voltage measurements. A satisfactory I-V test must be automated, so I looked into controlling the SourceMeter via GPIB. Keithley provides I-V testing software that can control SourceMeter units via GPIB. However, we did not have GPIB card in our PC and GPIB cards are rather expensive.
We did have a serial port, however, so in the end I hooked up the SourceMeter to the PC via the serial port and downloaded the full SourceMeter manual with programming and protocol information. By installing linux on the PC, it was easy to echo commands to the serial port for testing. Once I figured out how to "talk" with the SourceMeter via the serial port I wrote a program in perl to do all of the I-V curve generation and data manipulation.
Perl makes it very easy to pipe commands to the linux shell to write strings to the serial port. After writing the code to run a specified I-V sweep and read the data back into the computer into a CSV file, I wrote code to calculate the open circuit voltage, fill factor, max current, and so on from the data. Having gone that far I made a gnuplot script to auto-plot the data and save the graph as a .png image. Now, having both the plot and the data, I made a LaTeX template and extended my program to format the graph and solar cell testing results into an attractive PDF report. All of these documents are stored in a new directory with the sample number in the directory name.

Additionally the program can also be set up to compress into an archive the directory containing the CSV data, the calculated solar cell parameters, the image of the graph, and the formatted PDF report and email it to any email address. Thus with a little bit of coding I was able to create a very nice automated test setup with very little monetary outlay and only a moderate time outlay.